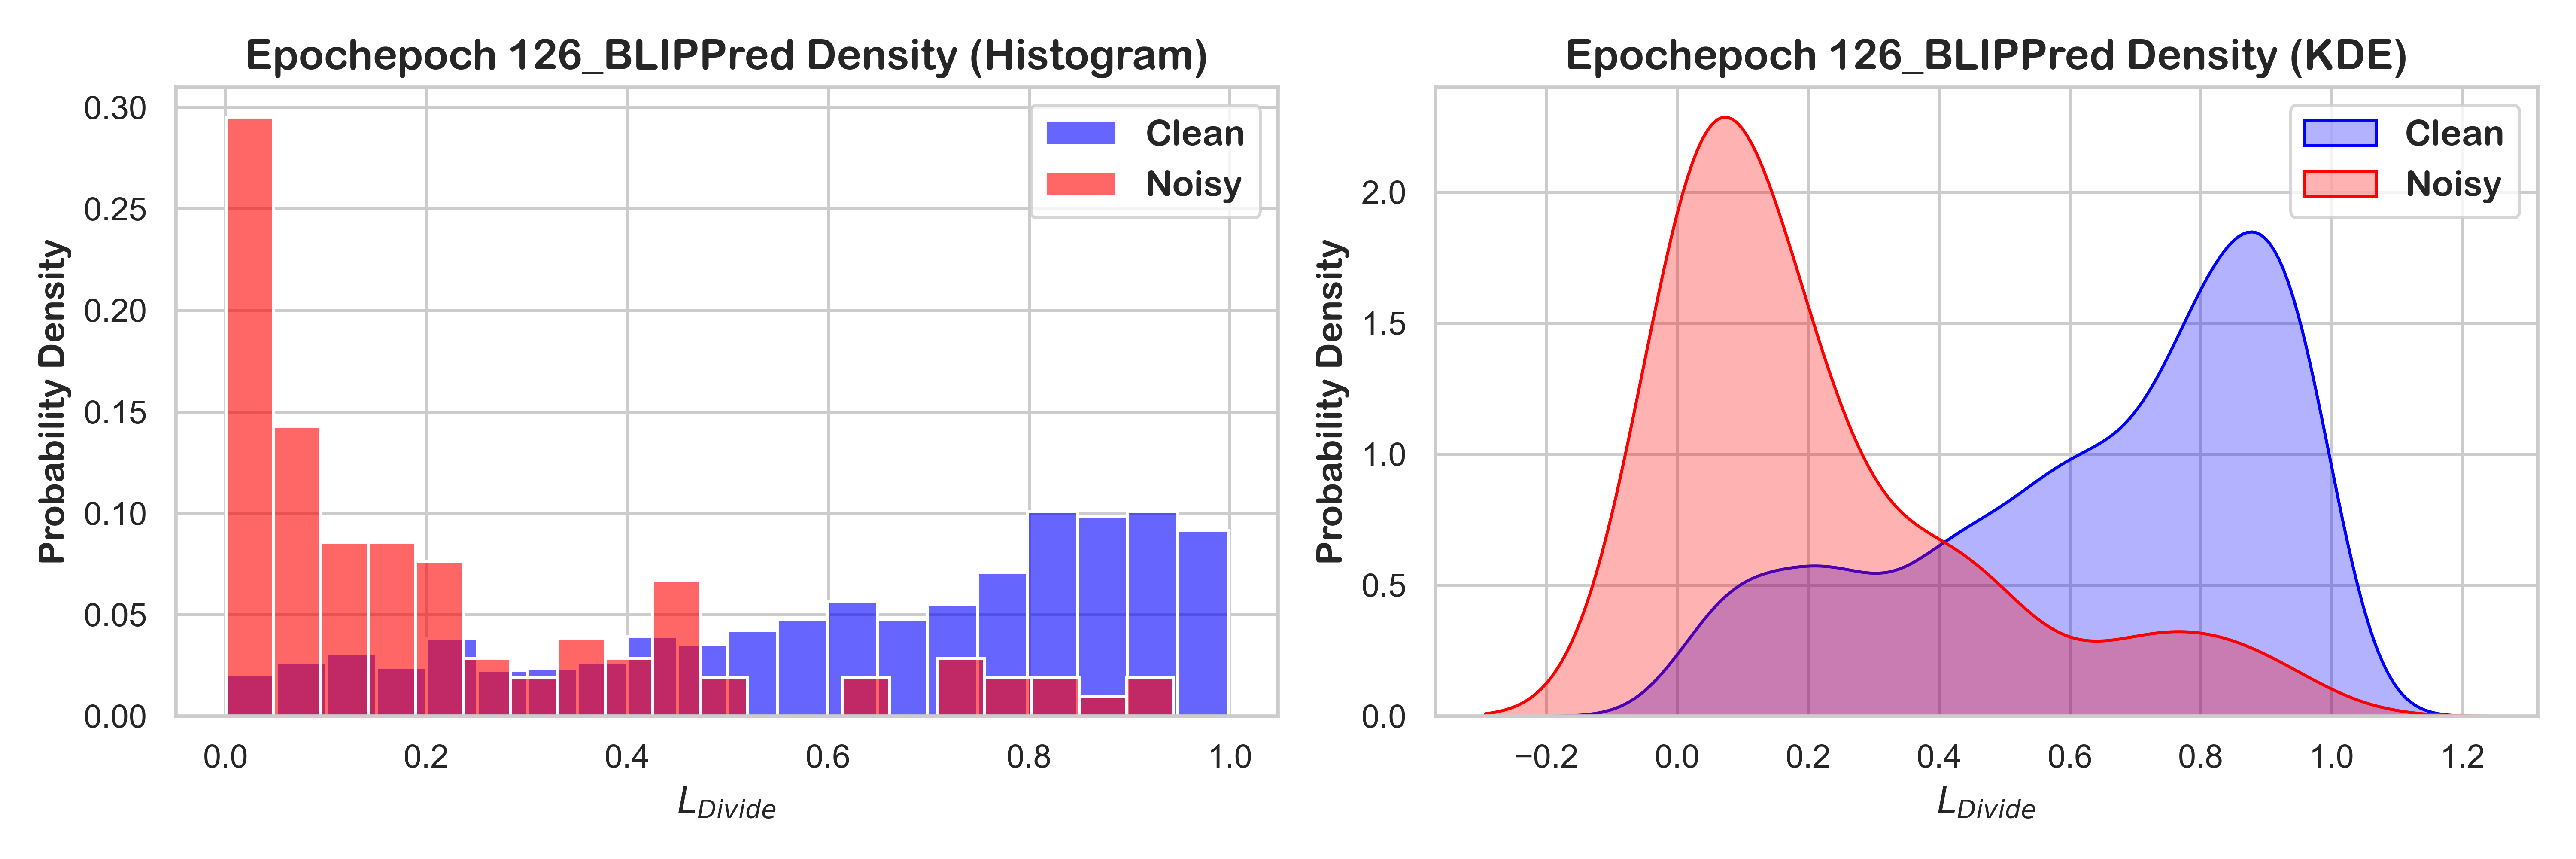
1
2
3
4
5
6
7
8
9
10
11
12
13
14
15
16
17
18
19
20
21
22
23
24
25
26
27
28
29
30
31
32
33
34
35
36
37
38
39
40
41
42
43
44
45
46
47
48
49
50
51
52
53
54
55
56
57
58
59
60
61
62
63
64
65
66
67
68
69
70
71
72
73
74
75
76
77
78
79
80
81
82
83
84
85
86
87
88
89
90
91
92
93
94
95
96
97
98
99
| class GraphPlotTool(DataProcessor):
def __init__(self, fname1="times.ttf", fname2="ARLRDBD.TTF"):
super().__init__()
sns.set(style="whitegrid")
self.title_fontsize = 12
self.label_fontsize = 10
self.fname1 = "../fonts/" + fname1
self.fname2 = "../fonts/" + fname2
self.digit_fontprop = FontProperties(fname=self.fname1)
self.title_fontprop = FontProperties(fname=self.fname2)
self.legend_fontprop = FontProperties(fname=self.fname2)
self.colors_name = ['yellow', 'blue', 'green', 'magenta', 'red', 'cyan', 'purple', 'orange', 'gray', 'pink']
self.colors_rgb = ['#f94144', '#f3722c', '#f8961e', '#f9844a', '#f9c74f', '#90be6d', '#43aa8b', '#4d908e', '#577590', '#277da1']
self.figsize = (12, 4)
self.dpi = 500
def HistKdePlot(self, image_name, data_name, data_clean, data_noisy, output_dir):
"""
Plot a Histgram compared to a Kde according by row.
params:
image_name: the name of image file.
data_names: a string list has the shape of (rows, cols).
data_clean: a sub-dataset in a sub-graph.
data_noisy: another sub-dataset in a sub-graph.
output_dir: the directory to save the images.
"""
fig, axes = plt.subplots(1, 2, figsize=(12, 4), dpi=self.dpi)
sns.histplot(data_clean, color="blue", label="Clean", kde=False, stat="probability", bins=20, alpha=0.6, ax=axes[0])
sns.histplot(data_noisy, color="red", label="Noisy", kde=False, stat="probability", bins=20, alpha=0.6, ax=axes[0])
axes[0].set_title(f'{data_name} Density (Histogram)', fontproperties=self.title_fontprop, fontsize=self.title_fontsize+2)
axes[0].set_xlabel(r'$L_{Divide}$', fontproperties=self.title_fontprop, fontsize=self.label_fontsize+2)
axes[0].set_ylabel('Probability Density', fontproperties=self.title_fontprop, fontsize=self.label_fontsize+2)
axes[0].legend(prop=self.legend_fontprop)
sns.kdeplot(data_clean, color="blue", label="Clean", fill=True, ax=axes[1], alpha=0.3)
sns.kdeplot(data_noisy, color="red", label="Noisy", fill=True, ax=axes[1], alpha=0.3)
axes[1].set_title(f'{data_name} Density (KDE)', fontproperties=self.title_fontprop, fontsize=self.title_fontsize+2)
axes[1].set_xlabel(r'$L_{Divide}$', fontproperties=self.title_fontprop, fontsize=self.label_fontsize+2)
axes[1].set_ylabel('Probability Density', fontproperties=self.title_fontprop, fontsize=self.label_fontsize+2)
axes[1].legend(prop=self.legend_fontprop)
plt.tight_layout()
folder_path = os.path.join(output_dir)
if not os.path.exists(folder_path):
os.makedirs(folder_path)
plt.savefig(os.path.join(folder_path, f"{image_name}.png"), format="png")
plt.show()
def HistComparePlot(self, image_name, data_names, data_clean, data_noisy, output_dir):
"""
Plot multiple Histgrams to compare by row.
params:
image_name: the name of image file.
data_names: a string list has the shape of (rows, cols).
data_clean: a sub-dataset in a sub-graph.
data_noisy: another sub-dataset in a sub-graph.
output_dir: the directory to save the images.
"""
rows, cols = len(data_names), len(data_names[0])
legend_fontprop = FontProperties(fname=self.fname2, size=8)
fig, axes = plt.subplots(rows, cols, figsize=(12, 4), dpi=self.dpi)
for row in range(rows):
for col in range(cols):
sub_clean, sub_noisy = data_clean[row][col], data_noisy[row][col]
sns.histplot(sub_clean, color="blue", label="Clean", kde=False, stat="probability", bins=20, alpha=0.6, ax=axes[row, col])
sns.histplot(sub_noisy, color="red", label="Noisy", kde=False, stat="probability", bins=20, alpha=0.6, ax=axes[row, col])
axes[row, col].set_title(f'{data_names[row][col]}', fontproperties=self.title_fontprop, fontsize=self.title_fontsize)
axes[row, col].set_xlabel('')
axes[row, col].set_ylabel('')
axes[row, col].legend(prop=legend_fontprop)
for col in range(cols):
axes[1, col].set_xlabel(r'$Score_{BLIP}$', fontproperties=self.title_fontprop, fontsize=self.label_fontsize)
for row in range(rows):
axes[row, 0].set_ylabel('Probability Density', fontproperties=self.title_fontprop, fontsize=self.label_fontsize)
plt.tight_layout()
folder_path = os.path.join(output_dir)
if not os.path.exists(folder_path):
os.makedirs(folder_path)
plt.savefig(os.path.join(folder_path, f"{image_name}.png"), format="png")
plt.show()
|


